Monitoring with Telegraf, InfluxDB and Grafana
Table of Contents
I've been using Munin for the past years as my monitoring tool. It works well, it's light, and super easy to set up.
It's a bit old and limited though, so it's time to look at what kind of monitoring software we have in 2018.
Instead of having one software that does everything nowadays we like to separate the roles this way:
- The collector, which you will install on the machines you want to monitor
- The database that will store all the measurements
- The visualization system, e.g. a web dashboard
The 3 most popular stacks seems, for me, to be:
But there are a lot of other softwares like Collectd, Grafite, OpenTSDB,etc. (Just look at Grafana's possible sources
ELK is overkill for us (the "E"...), and is more used to process logs. Prometheus is a nice option, but as you read in the title, we're going to see how to setup TIG in this post.
I was afraid at first because I thought all these hype softwares were a pain to install, but as you'll see, they're actually super simple to setup.
Table of content#
- Table of content
- The TIG stack
- InfluxDB installation
- Configure InfluxDB
- Install Telegraf
- Configure Telegraf
- Grafana installation
- Grafana configuration
- Grafana dashboard
- InfluxDB over HTTPS
The TIG stack#
A bit more information about our stack: Telegraf and InfluxDB are actually made by the same people, InfluxData. They're both open source and written in go. InfluxData provide the complete stack with Chronograf for displaying the data and Kapacitor for the alerting. This makes the TICK stack.
As Grafana is a very high quality software that can also do alerting, I chose to use it. It's also more advanced than Chronograf. As you can see, we really have a lot of possibilities!
FYI we won't use Docker at all in the post, but you can run the components in containers if you want.
InfluxDB installation#
Following https://docs.influxdata.com/influxdb/v1.5/introduction/installation/ for Debian 9.
curl -sL https://repos.influxdata.com/influxdb.key | sudo apt-key add -
echo "deb https://repos.influxdata.com/debian stretch stable" > /etc/apt/sources.list.d/influxdata.list
apt-get update
apt-get install influxdb
systemctl start influxdb
Configure InfluxDB#
InfluxDB is a time-series database compatible with SQL, so we can setup a user and database easily. You can launch its shell with the influx command.
root@server ~# influx
Connected to http://localhost:8086 version 1.5.1
InfluxDB shell version: 1.5.1
Create the database:
> CREATE DATABASE telegraf
> SHOW DATABASES
name: databases
name
----
_internal
telegraf
Create a user. Choose a good password as InfluxDB will be exposed to the internet.
> CREATE USER telegraf WITH PASSWORD 'superpa$$word'
> GRANT ALL ON telegraf TO telegraf
> SHOW USERS;
user admin
---- -----
telegraf false
You can setup a retention policy if you wish
> CREATE RETENTION POLICY thirty_days ON telegraf DURATION 30d REPLICATION 1 DEFAULT
> SHOW RETENTION POLICIES ON telegraf
name duration	replicaN	DEFAULT
DEFAULT 0 1 FALSE
thirty_days	720h0m0s	1 TRUE
Install Telegraf#
As I said before Telegraf and InfluxDB are made by the same company, so they use the same APT repository.
#curl -sL https://repos.influxdata.com/influxdb.key | sudo apt-key add -
#echo "deb https://repos.influxdata.com/debian stretch stable" > /etc/apt/sources.list.d/influxdata.list
#apt-get update
apt install telegraf
systemctl start telegraf
Configure Telegraf#
Let's backup the configuration file:
mv /etc/telegraf/telegraf.conf /etc/telegraf/telegraf.conf.origI suggest you to read it, but here's a quick start on what you can add in /etc/telegraf/telegraf.conf.
Agent configuration:
[agent]
  hostname = "myserver"
  flush_interval = "15s"
  interval = "15s"
By default, the hostname will be the server hostname (makes sense), and the metrics will be collected every 10 seconds.
Basic inputs configuration, e.g. probes:
[[inputs.cpu]]

[[inputs.mem]]

[[inputs.system]]

[[inputs.disk]]
  mount_points = ["/"]

[[inputs.processes]]

[[inputs.net]]
  fieldpass = ["bytes_*"]
To see all the inputs available you can type:
grep inputs. /etc/telegraf/telegraf.conf.origI usually take a look at the inputs folder in the github repo because each inputs has a README that helps to set it up.
Then the outputs, which is our InfluxDB database:
[[outputs.influxdb]]
  database = "telegraf"
  urls = ["http://127.0.0.1:8086"]
  username = "telegraf"
  password = "pa$$word"
Then we can restart telegraf and the metrics will begin to be collected and sent to InfluxDB.
service telegraf restart> use telegraf
Using database telegraf
> SELECT * FROM processes LIMIT 5
name: processes
time blocked dead host idle paging running sleeping stopped total total_threads unknown zombies
---- ------- ---- ---- ---- ------ ------- -------- ------- ----- ------------- ------- -------
1522362620000000000 0 0 nagisa 0 0 5 29 0 35 85 0 1
1522362630000000000 1 0 nagisa 0 0 1 30 0 32 82 0 0
1522362640000000000 1 0 nagisa 0 0 1 30 0 32 83 0 0
1522362650000000000 0 0 nagisa 0 0 1 27 0 28 80 0 0
1522362660000000000 0 0 nagisa 0 0 1 27 0 28 80 0 0You can see what Telegraf collects with this command:
telegraf -test -config /etc/telegraf/telegraf.confThis is very useful when adding new plugins:
root@server ~# telegraf -test -config /etc/telegraf/telegraf.conf --input-filter cpu
* Plugin: inputs.cpu, Collection 1
* Plugin: inputs.cpu, Collection 2
> cpu,cpu=cpu0,host=server usage_user=1.9999999999527063,usage_system=0,usage_idle=97.99999999813735,usage_iowait=0,usage_steal=0,usage_guest=0,usage_nice=0,usage_irq=0,usage_softirq=0,usage_guest_nice=0 1522576796000000000
> cpu,cpu=cpu-total,host=nagisa usage_steal=0,usage_user=1.9999999999527063,usage_nice=0,usage_irq=0,usage_softirq=0,usage_guest=0,usage_guest_nice=0,usage_system=0,usage_idle=97.99999999813735,usage_iowait=0 1522576796000000000
Grafana installation#
Grafana is the web app that we will plug to InfluxDB to visualize the data.
We will install Grafana using their APT repo, as described in http://docs.grafana.org/installation/debian/.
echo "deb https://packagecloud.io/grafana/stable/debian/ stretch main" > /etc/apt/sources.list.d/grafana.list
curl https://packagecloud.io/gpg.key | sudo apt-key add -
apt install apt-transport-https
apt update
apt install grafana
Grafana configuration#
The configuration takes place in /etc/grafana/grafana.ini.
The defaults are fine and Grafana will use SQLite to store its data.
Though, here is what I recommend to change :
http_addr = 127.0.0.1
domain = grafana.domain.tld
enable_gzip = true
root_url = https://grafana.domain.tld
Then we restart Grafana and we enable it at boot:
service grafana-server restart
systemctl enable grafana-server
Then we'll use Nginx configured as reverse proxy to access Grafana via HTTPS. You can use HTTPS directly with Grafana but I want to access it with port 443 and I already have Nginx installed, so..
To generate a certificate, I recommend acme.sh.
Then here's a server block example:
server {
    listen 80;
    listen [::]:80;
    server_name grafana.domain.tld;
    return 301 https://grafana.domain.tld$request_uri;

    access_log /dev/null;
    error_log /dev/null;
}
server {
    listen 443 ssl http2;
    listen [::]:443 ssl http2;
    server_name grafana.domain.tld;

    access_log /var/log/nginx/grafana-access.log;
    error_log /var/log/nginx/grafana-error.log;

    location / {
        proxy_set_header Host $http_host;
        proxy_set_header X-Real-IP $remote_addr;
        proxy_set_header X-Forwarded-For $proxy_add_x_forwarded_for;
        proxy_set_header X-Forwarded-Proto $scheme;
        proxy_pass http://127.0.0.1:3000;
    }
}
You can now login using the default admin/admin credentials.

Once you're in, create a new user and delete the admin user immediately.
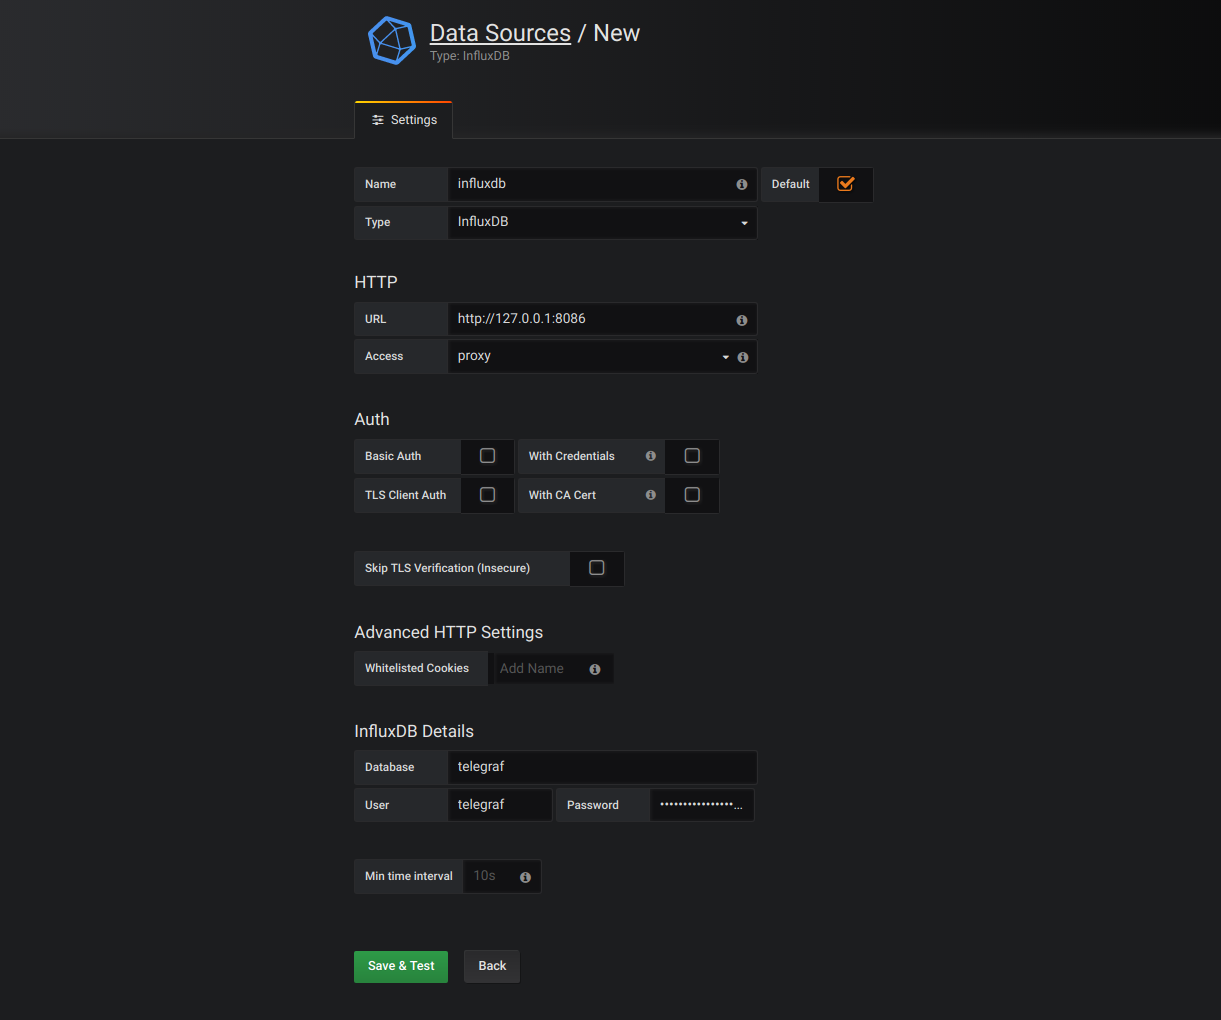
Add your InfluxDB database as a source:
Grafana dashboard#
You can now add a dashboard and begin to configure panels.
Here a CPU panel example queries:
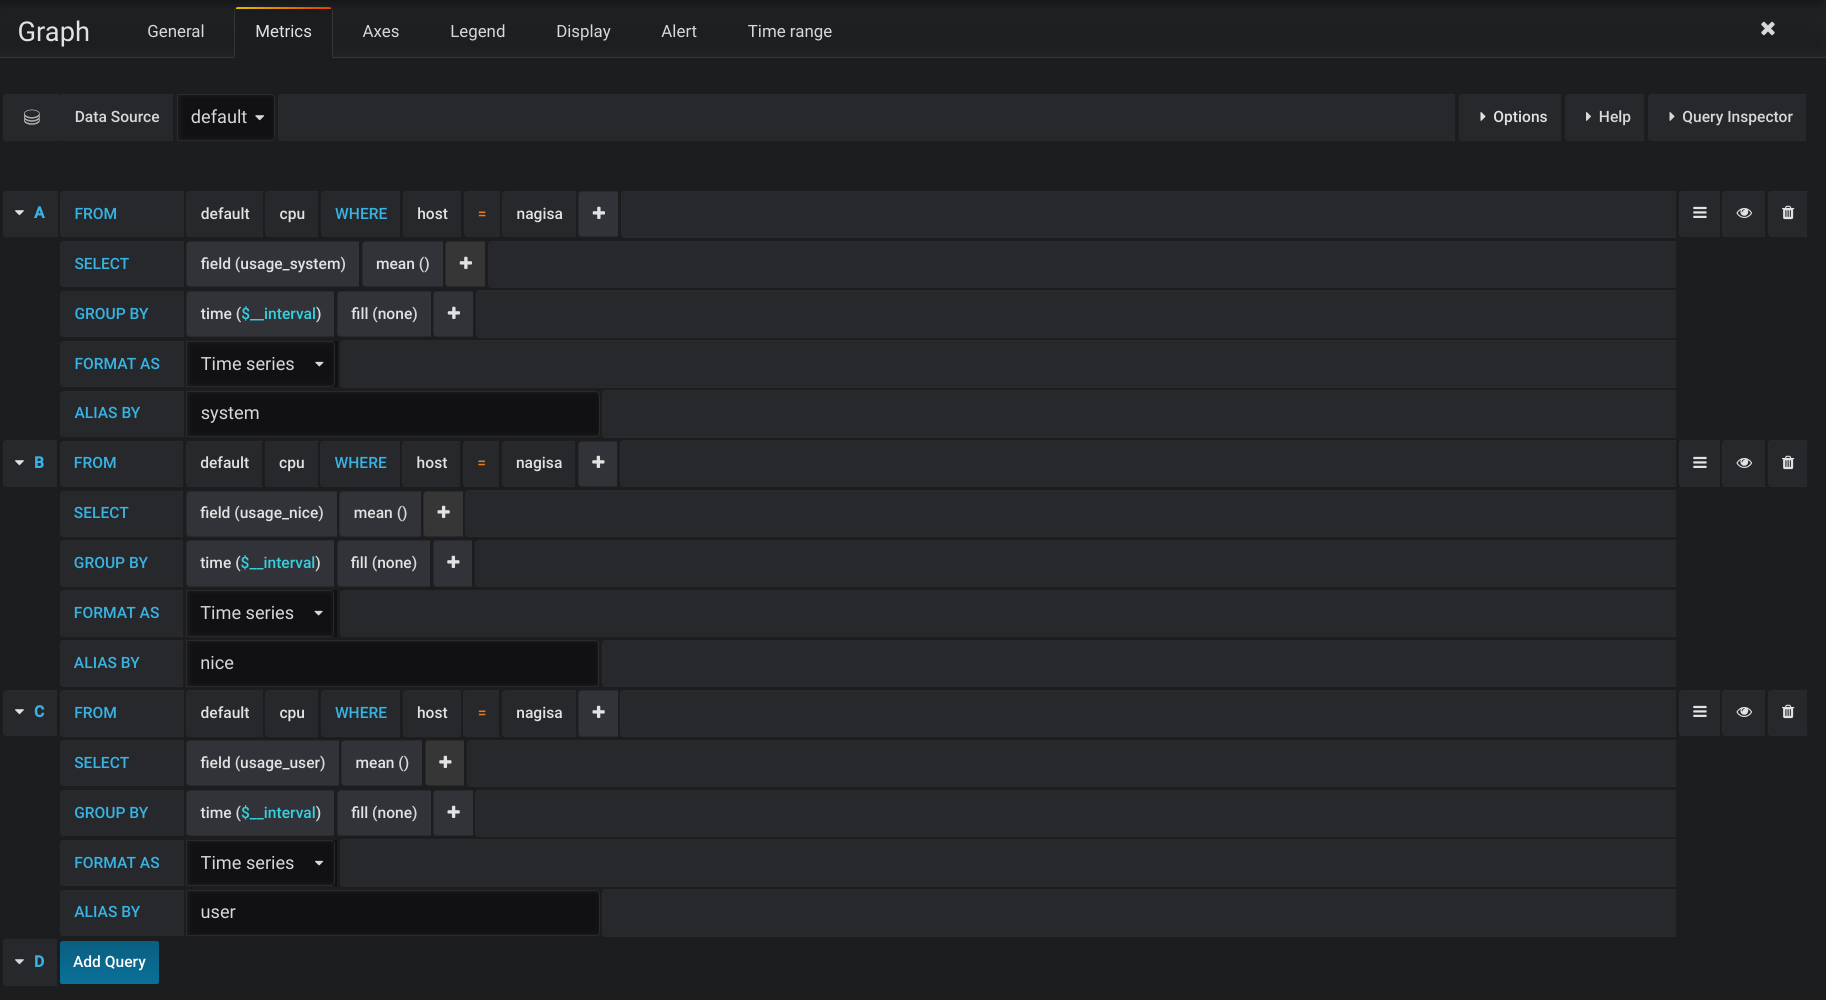
Play around with the measurements and graphs and you will begin to get how it works.
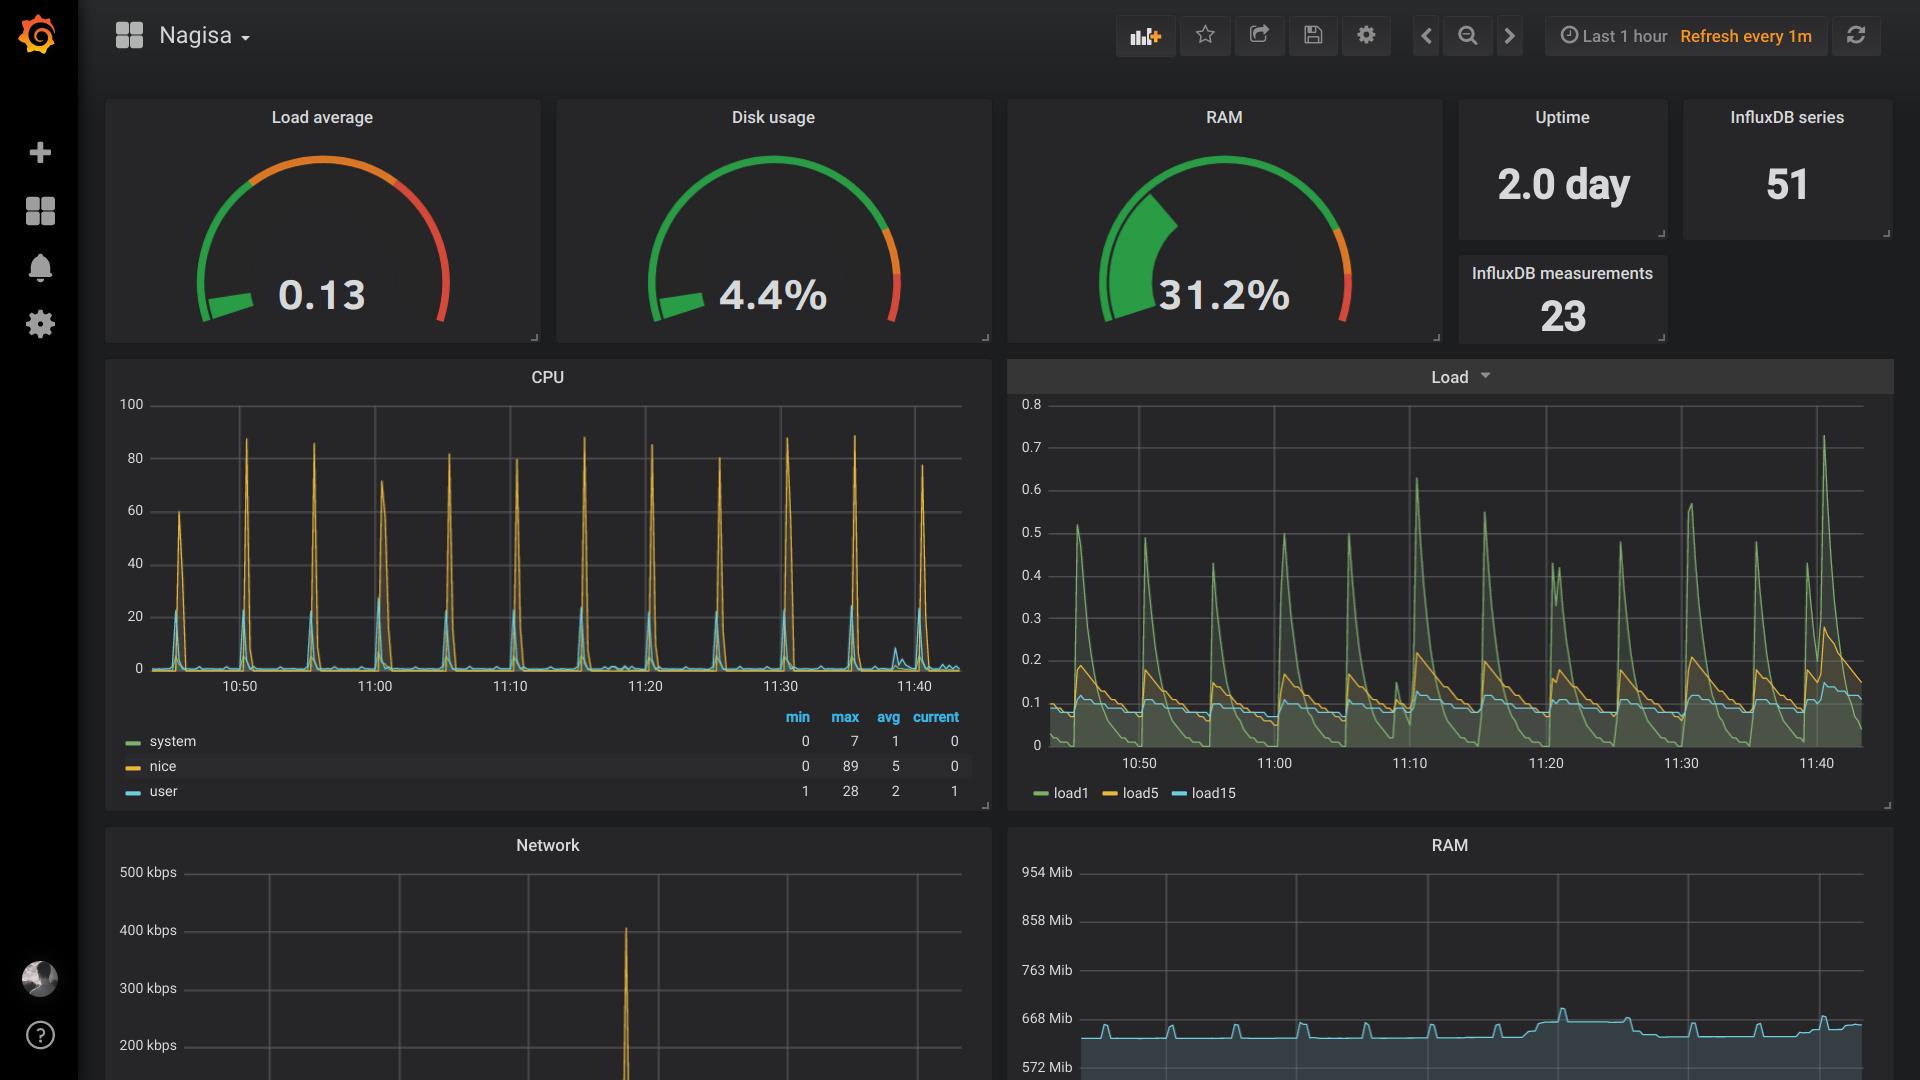
Here is how one of my dashboards looks like:
FYI, there are 2 kinds of measurements:
- the ones that show you how much of $ there is at one instant
- the ones that show you the total amount of $ since the last start of $$
That does not makes sense so here are examples:
- At this moment there are x numbers of processes
- There has been x bytes transmitted since this interface is up
The thing is the second type will show you increasing graphs which are pointless, so you'll have to add "transformation" -> "derivative" to your select query so that it will show the difference between each measurements.
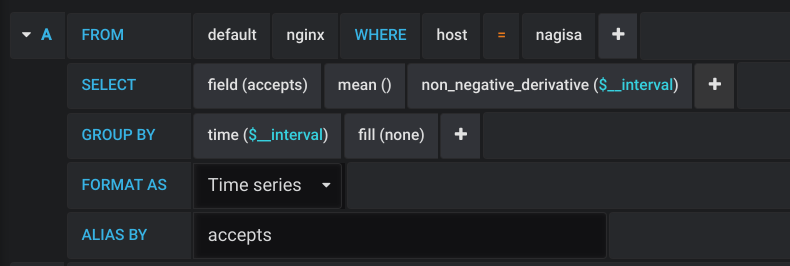
Example with Nginx, where half the metrics are the first type and the other is the second.
root@server ~# curl http://127.0.0.1/status
Active connections: 2
server accepts handled requests
 1192 1192 12255 # First type, use derivative
Reading: 0 Writing: 1 Waiting: 1 # second type, do not use

root@server ~# telegraf -test -config /etc/telegraf/telegraf.conf --input-filter nginx
* Plugin: inputs.nginx, Collection 1
> nginx,port=80,host=server,server=127.0.0.1 handled=1193i,requests=12256i,reading=0i,writing=1i,waiting=1i,active=2i,accepts=1193i 1522576850000000000
Let's take "accepts", "handled" and "requests" as an example:
Without derivative:
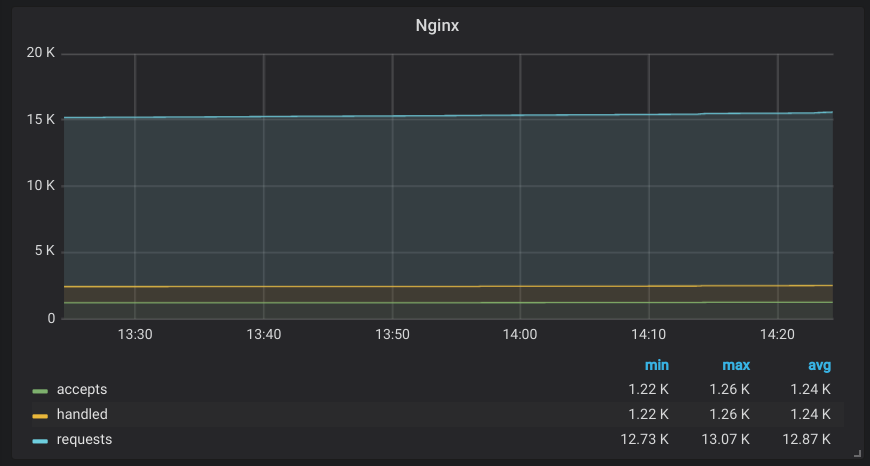
With derivative:
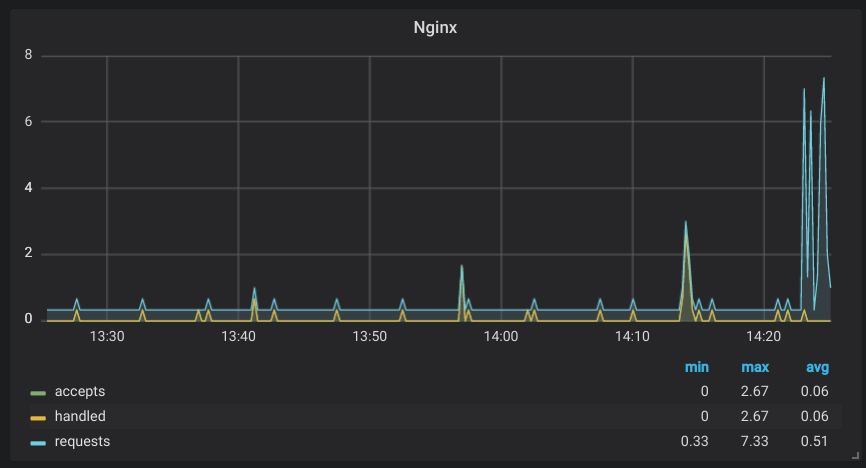
InfluxDB over HTTPS#
So now, we want to monitor other servers and send the data to InfluxDB. To do this securely, we will use HTTPS, as InfluxDB communicates trough HTTP.
FYI, don't use Nginx to do HTTPS for InfluxDB. This will mess up your data and database. You have to use the HTTPS implementation of InfluxDB.
First we want to have certificates. You can get them the same way you did for Grafana, with acme.sh.
Don't forget to give InfluxDB the rights to the read them:
chown influxdb /path/to/cert_and_keyThen enable HTTPS in /etc/influxdb/influxdb.conf:
https-enabled = true
https-certificate = "/path/to/domain.tld.fullchain.pem"
https-private-key = "/path/to/domain.tld.key.pem"service influxdb restartNow, we can't use InfluxDB on localhost trough localhost.
You'll have to modify /etc/telegraf/telegraf.conf:
[[outputs.influxdb]]
  database = "telegraf"
  urls = ["https://influxdb.domain.tld:8086"]
  username = "telegraf"
  password = "pa$$word"
You will use the same config on all the other servers you'll monitor.
Next, you will have to update Grafana:
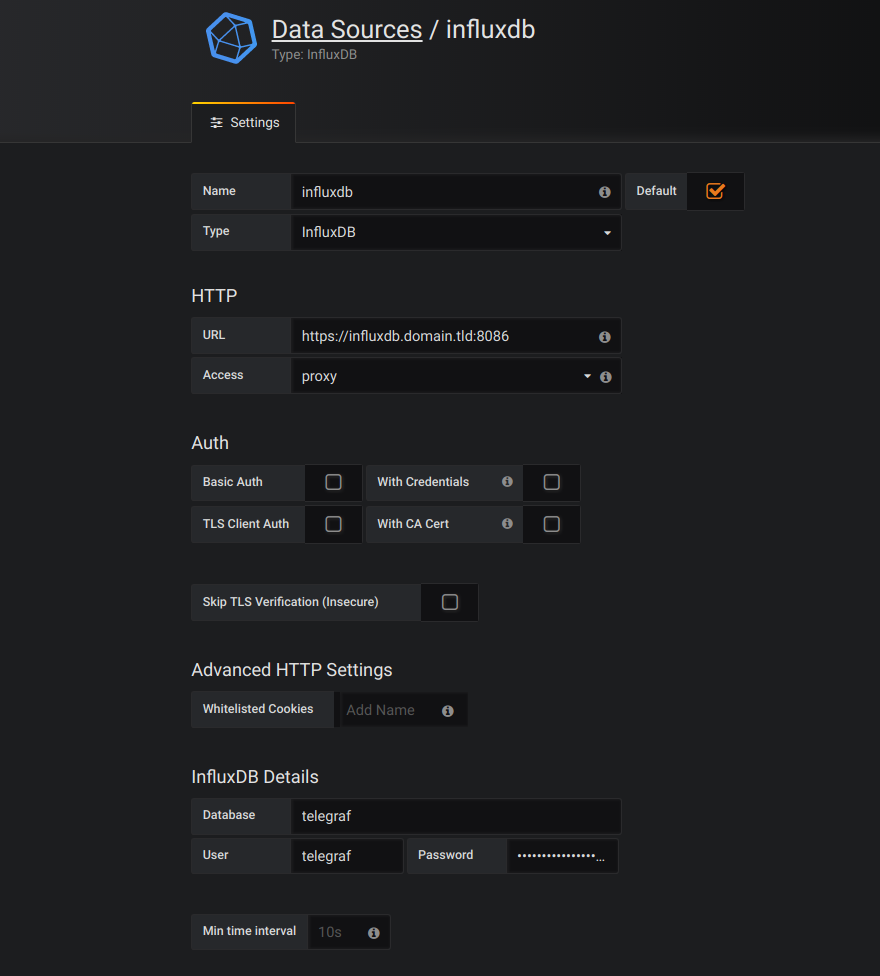
And you're good to go.
The new command to connect to influx is:
influx -host influxdb.domain.tld -sslNow you're ready to add other servers to monitor. To do so, just install and configure Telegraf the exact same way, and use your InfluxDB database trough HTTPS to store the metrics. Easy!
I don't cover alerting in this post because it's not specific to the stack and you will find resources online on how to configure it on Grafana. A few months ago I used Telegram and WebDav:
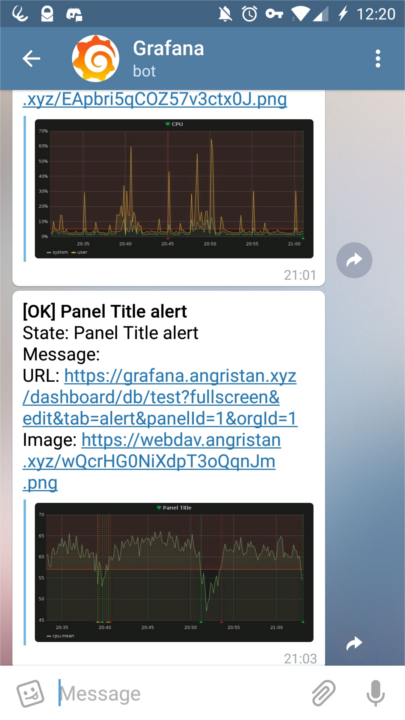
Pretty neat right?
I hope you will find this post useful. As for me I'll take a look in the TICK stack to see how it performs compared to TIG.
Ressources:
Header image: https://gableroux.com/presentation/2016/06/21/influxdb-telegraf-grafana/ (super cute)